| ||||||||||||||
| County of Riverside | |||
|---|---|---|---|
| — County — | |||
|
|||
 |
|||
 |
|||
| Country | United States | ||
| State | California | ||
| Region/Metro area | Inland Empire | ||
| Incorporated | 1893 | ||
| Named for | Riverside | ||
| County seat | Riverside | ||
| Largest city | Riverside | ||
| Government | |||
| • Board of Supervisors | Supervisors
|
||
| Area | |||
| • Total | 7,303.13 sq mi (18,915.0 km2) | ||
| • Land | 7,207.37 sq mi (18,667.0 km2) | ||
| • Water | 95.76 sq mi (248.0 km2) | ||
| Population (2010 Census) | 2,189,641 | ||
| Time zone | Pacific Standard Time (UTC-8) | ||
| • Summer (DST) | Pacific Daylight Time (UTC-7) | ||
| Website | countyofriverside.us | ||
Riverside County is a county in the U.S. state of California. One of 58 California counties, it covers 7,208 sq mi (18,669 km2) in the southern part of the state, and stretches from Orange County to the Colorado River, which forms the state border with Arizona. The county derives its name from the city of Riverside, which is the county seat. Along with neighboring San Bernardino County, the two counties have been dubbed the 'Inland Empire'.
The population of Riverside County was 2,189,641 in 2010.
Geographically, the county is mostly desert in the central and eastern portions of the county, and is a Mediterranean climate in the western portion of the county. Most of Joshua Tree National Park is located in the county. Riverside County lies inland of Los Angeles County and is bordered by Orange County to the west, San Bernardino County to the north, and San Diego County and Imperial County to the south. Large numbers of Los Angeles area workers have moved to the county in recent years to take advantage of relatively affordable housing. Alongside neighboring San Bernardino County, it was one of the fastest growing regions in the state prior to the recent changes in the regional economy. In addition, smaller, but significant, numbers of people have been moving into Southwest Riverside County from the San Diego metropolitan area. The cities of Temecula and Murrieta account for 20% of increase in population of Riverside County between 2000 and 2007.
The famous resort cities of the Coachella Valley such as Indian Wells, La Quinta, Rancho Mirage, Palm Springs and Palm Desert are located in Riverside County. Indio is the center of an important date growing region.
History
The indigenous peoples of what is now Riverside County are the Luiseño, Cupeño and Cahuilla Indians.[1] When the initial 27 California counties were established in 1850 the area today known as Riverside County was divided between Los Angeles County and San Diego County. In 1853 the eastern part of Los Angeles County was used to create San Bernardino County. Between 1891 and 1893 several proposals, and legislative attempts, were put forth to form new counties in Southern California. These proposals included one for a Pomona County and one for a San Jacinto County. None of the proposals were adopted until a measure to create Riverside County was signed by Governor Henry H. Markham on March 11, 1893.[2]
The new county was created from parts of San Bernardino County and San Diego County. On May 2, 1893, seventy percent of voters approved the formation of Riverside County. Voters chose the city of Riverside as the county seat, also by a large margin. Riverside County was officially formed on May 9, 1893, when the Board of Commissioners filed the final canvass of the votes.[2]
Riverside County is the birthplace of lane markings, thanks to Dr. June McCarroll, as well as modern Native American gaming enterprises. In the early 1980s, the county government attempted to shut down small bingo halls operated by the Morongo Band of Cahuilla Mission Indians and the Cabazon Band of Mission Indians. The tribes joined forces and fought the county all the way to the U.S. Supreme Court, which ruled in the tribes' favor on February 25, 1987.[3] In turn, Congress enacted the Indian Gaming Regulatory Act in 1988 to establish a legal framework for the relationship between Indian gaming and state governments. Naturally, both tribes now operate large casinos in the county: the Morongo Casino, Resort & Spa and the Fantasy Springs Resort Casino.
The county's population surpassed one million people in 1980 when the current trend of high population growth as a major real estate destination began in the 1970s.
Geography
According to the 2000 census, the county has a total area of 7,303.13 square miles (18,915.0 km2), of which 7,207.37 square miles (18,667.0 km2) (or 98.69%) is land and 95.76 square miles (248.0 km2) (or 1.31%) is water.[4] At roughly 180 miles (290 km) wide in the east-west dimension, the area of the county is massive. Riverside County, California is roughly the size of the State of New Jersey in total area. County government documents frequently cite the Colorado River town of Blythe as being a "three-hour drive" from the county seat, Riverside. Some view the areas west of San Gorgonio Pass as the Inland Empire portion of the county and the eastern part as either the Mojave Desert or Colorado Desert portion. There are probably at least three geomorphic provinces: the Inland Empire western portion, the Santa Rosa Mountains communities such as Reinhardt Canyon and the desert region. Other possible subdivisions include tribal lands, the Colorado River communities, and the Salton Sea.
Incorporated cities
| Riverside County cities |
Year incorporated |
Population, 2007[5] |
Median household income, 2006[5] |
|---|---|---|---|
| Banning | 1913 | 28,272 | $41,268 |
| Beaumont | 1912 | 28,250 | $39,553 |
| Blythe | 1916 | 22,178 | $45,302 |
| Calimesa | 1990 | 7,415 | $47,406 |
| Canyon Lake | 1990 | 10,939 | $70,106 |
| Cathedral City | 1981 | 51,081 | $50,654 |
| Coachella | 1946 | 35,207 | $33,402 |
| Corona | 1896 | 144,661 | $72,162 |
| Desert Hot Springs | 1963 | 22,011 | $33,263 |
| Eastvale | 2010 | -- | -- |
| Hemet | 1910 | 69,544 | $31,749 |
| Indian Wells | 1967 | 4,865 | $120,074 |
| Indio | 1930 | 71,654 | $45,143 |
| Jurupa Valley | 2011 | 88,000 | |
| Lake Elsinore | 1888 | 40,985 | $54,595 |
| La Quinta | 1982 | 38,340 | $71,127 |
| Menifee | 2008 | 60,000 | -- |
| Moreno Valley | 1984 | 174,565 | $52,426 |
| Murrieta | 1991 | 103,466 | $75,102 |
| Norco | 1964 | 27,262 | $62,652 |
| Palm Desert | 1973 | 49,539 | $61,789 |
| Palm Springs | 1938 | 46,437 | $46,399 |
| Perris | 1911 | 47,139 | $35,338 |
| Rancho Mirage | 1973 | 16,672 | $78,434 |
| Riverside | 1883 | 287,820 | $52,023 |
| San Jacinto | 1888 | 31,066 | $39,235 |
| Temecula | 1989 | 93,923 | $71,754 |
| Wildomar | 2008 | 14,064 | $49,081 |
Unincorporated communities and neighborhoods
|
|
|
Indian reservations
Riverside County has 12 federally-recognized Indian reservations, which ties it with Sandoval County, New Mexico for second most of any county in the United States. (Sandoval County, however, has two additional joint-use areas, shared between reservations. San Diego County, California has the most, with 18 reservations.)
- Agua Caliente Indian Reservation
- Augustine Indian Reservation
- Cabazon Indian Reservation
- Cahuilla Indian Reservation
- Colorado River Indian Reservation (partly in La Paz County, Arizona and San Bernardino County, California)
- Morongo Indian Reservation
- Pechanga Indian Reservation
- Ramona Village
- Santa Rosa Indian Reservation
- Soboba Band of Mission Indians
- Torres-Martinez Indian Reservation (partly in Imperial County, California)
- Twenty-Nine Palms Indian Reservation (partly in San Bernardino County)
Adjacent counties
- Imperial County, California
- Orange County, California
- San Bernardino County, California
- San Diego County, California
National protected areas
- Cleveland National Forest (part)
- Coachella Valley National Wildlife Refuge
- Joshua Tree National Park (part)
- San Bernardino National Forest (part)
- Santa Rosa and San Jacinto Mountains National Monument
Flora and fauna
There is a diversity of flora and fauna within Riverside County. Vegetative plant associations feature many desert flora, but there are also forested areas within the county. The California endemic Blue oak, Quercus douglasii is at the southernmost part of it its range in Riverside County.[6]
Transportation infrastructure
Major highways
|
|
|
Public transportation
- Riverside Transit Agency serves the western third of Riverside County, as far east as Banning.
- SunLine Transit Agency serves Palm Springs and the Coachella Valley area.
- Palo Verde Valley Transit Agency provides service in Blythe, near the Arizona border.
- Pass Transit serves the San Gorgonio Pass communities.
- Corona Cruiser serves the community of Corona.
Riverside County is also served by Greyhound buses. Amtrak trains stop in Riverside and Palm Springs, and Amtrak California provides bus connections to the San Joaquins in Riverside, Beaumont, Palm Springs, Thousand Palms, Indio, Moreno Valley, Perris, Sun City and Hemet. Metrolink trains serve five stations in Riverside County: Riverside-Downtown, Riverside-La Sierra, North Main-Corona, West Corona, and Pedley Station (in unincorporated Pedley, California). These trains provide service to Orange, San Bernardino and Los Angeles counties seven days a week, with a primarily commuter-oriented schedule.
Airports
Commercial airports
- Palm Springs International Airport
- March Air Reserve Base may be converted to a commercial use municipal airport[7] and, eventually, an alternative international airport.[8] A proposal for converting the airport into an international airport was rejected in 2005.
General aviation airports
- Banning Municipal Airport
- Bermuda Dunes Airport
- Blythe Municipal Airport
- Corona Municipal Airport
- Flabob Airport, Riverside
- French Valley Airport, Murrieta (Temecula Valley)
- Hemet-Ryan Airport (San Jacinto Valley)
- Jacqueline Cochran Regional Airport, Thermal (Coachella Valley)
- Perris Valley Airport
- Riverside Municipal Airport
Government, law, and politics
Government
Riverside County is organized as a General Law County under the provision of the California Government Code. The county has five supervisorial districts, and one supervisor is elected from each district every four years.[9]
A General Plan was prepared for the county by the firm of Earth Metrics in the year 1994;[10] in 2003 the County Supervisors authorized updating the plan with respect to certain unincorporated areas.
Law


Riverside County Historic Courthouse
The Riverside Superior Court is the state trial court for Riverside County with 14 courthouses: Riverside Historic Courthouse, Riverside Hall of Justice, Riverside Family Law Court, Riverside Juvenile Court, Southwest Justice Center - Murrieta, Moreno Valley Court, Banning Court, Hemet Court, Corona Court, Temecula Court, Larson Justice Center - Indio, Indio Juvenile Court, Palm Springs Court and Blythe Court.[11]
The main courthouse is the Riverside Historic Courthouse. This landmark, erected in 1903, was modeled after the Grand and Petit Palais in Paris, France. The courthouse, designed by Los Angeles architects Burnham and Bliesner, has a classical design— including a great hall that connects all the departments (courtrooms).[12] In 1994, the courthouse was closed for seismic retrofits due to the 1992 Landers and 1994 Northridge earthquakes. The courthouse was reopened and rededicated in September 1998.[13]
Politics
| Year | GOP | DEM | Others |
|---|---|---|---|
| 2008 | 48.7% 293,349 | 49.7% 299,380 | 1.6% 10,530 |
| 2004 | 57.8% 322,473 | 41.0% 228,806 | 1.1% 6,300 |
| 2000 | 51.4% 231,955 | 44.9% 202,576 | 3.7% 16,596 |
| 1996 | 45.6% 178,611 | 43.1% 168,579 | 11.3% 44,423 |
| 1992 | 37.1% 159,457 | 38.6% 166,241 | 24.3% 104,577 |
| 1988 | 59.5% 199,979 | 39.6% 133,122 | 1.0% 3,247 |
| 1984 | 63.5% 182,324 | 35.5% 102,043 | 1.0% 2,835 |
| 1980 | 59.9% 145,642 | 31.5% 76,650 | 8.6% 20,986 |
| 1976 | 49.2% 97,774 | 48.5% 96,228 | 2.3% 4,556 |
| 1972 | 58.0% 108,120 | 38.4% 71,591 | 3.6% 6,693 |
| 1968 | 52.9% 83,414 | 38.8% 61,146 | 8.3% 13,110 |
| 1964 | 43.1% 61,165 | 56.8% 80,528 | 0.1% 95 |
| 1960 | 56.2% 65,855 | 43.4% 50,877 | 0.5% 544 |
| 1956 | 62.2% 56,766 | 37.3% 34,098 | 0.5% 465 |
| 1952 | 65.1% 51,692 | 33.9% 26,948 | 1.0% 788 |
| 1948 | 55.7% 32,209 | 40.3% 23,305 | 4.1% 2,350 |
| 1944 | 53.9% 23,168 | 45.3% 19,439 | 0.8% 346 |
| 1940 | 51.4% 21,779 | 47.2% 20,003 | 1.4% 598 |
| 1936 | 48.9% 16,674 | 49.9% 17,011 | 1.2% 422 |
| 1932 | 50.2% 14,112 | 45.4% 12,755 | 4.4% 1,245 |
| 1928 | 77.9% 17,600 | 21.1% 4,769 | 0.9% 212 |
| 1924 | 62.0% 9,619 | 8.5% 1,318 | 29.5% 4,579 |
| 1920 | 69.6% 9,124 | 21.3% 2,798 | 9.1% 1,196 |
Riverside has historically been regarded as a Republican county in presidential and congressional elections. In 1932, it was one of only two counties (the other being Benton County, Oregon) on the entire Pacific coast of the United States to vote for Hoover over Roosevelt.[14] In recent years, however, Democratic registration numbers have been increasing, and Democrats have made inroads in historically Republican strongholds. In 2008, Barack Obama narrowly carried the county, becoming the first Democrat to do so since Bill Clinton in 1992.
In the House of Representatives, a substantial portion of Riverside County lies in California's 45th congressional district, with parts in the 41st, 44th, and 49th districts. All four districts are held by Republicans, the 41st by Jerry Lewis, the 44th by Ken Calvert, the 45th by Mary Bono Mack, and the 49th by Darrell Issa.
In the State Assembly all of the 64th district and parts of the 63rd, 65th, 66th, 71st, and 80th districts lie in the county. The 63rd is currently vacant, the 64th is represented by Republican Brian Nestande, the 65th by Republican Paul Cook, the 71st by Republican Jeff Miller, and the 80th by Democrat Manuel Perez. In the 80th Assembly District, which has a significant Democratic voter registration edge, Democrats were able to take back the district after 14 years of Republican representation with Perez's victory.
In the State Senate all of the 37th district and parts of the 31st, 36th, and 40th districts are located in the county. The 31st, 36th, and 37th districts are held by Republicans, Robert Dutton, Dennis Hollingsworth, and Bill Emmerson respectively, and the 40th is held by Democrat Denise Moreno Ducheny.
Riverside County voted 64.8% in favor of Proposition 8 which amended the California Constitution to ban same-sex marriages.
Demographics
| Historical populations | |||
|---|---|---|---|
| Census | Pop. | %± | |
| 1900 | 17,897 | ||
| 1910 | 34,696 | 93.9% | |
| 1920 | 50,297 | 45.0% | |
| 1930 | 81,024 | 61.1% | |
| 1940 | 105,524 | 30.2% | |
| 1950 | 170,046 | 61.1% | |
| 1960 | 306,191 | 80.1% | |
| 1970 | 459,074 | 49.9% | |
| 1980 | 663,166 | 44.5% | |
| 1990 | 1,170,413 | 76.5% | |
| 2000 | 1,545,387 | 32.0% | |
| 2010 | 2,189,641 | 41.7% | |
2010
The 2010 United States Census reported that Riverside County had a population of 2,189,641. The racial makeup of Riverside County was 1,335,147 (61.0%) White, 140,543 (6.4%) African American, 23,710 (1.1%) Native American, 130,468 (6.0%) Asian (2.3% Filipino, 0.8% Chinese, 0.7% Vietnamese, 0.6% Korean, 0.5% Indian, 0.2% Japanese, 0.1% Cambodian, 0.1% Laotian, 0.1% Pakistani), 6,874 (0.3%) Pacific Islander, 448,235 (20.5%) from other races, and 104,664 (4.8%) from two or more races. Hispanic or Latino of any race were 995,257 persons (45.5%); 39.5% of Riverside County is Mexican, 0.8% Salvadoran, 0.7% Honduran, 0.6% Puerto Rican, 0.3% Cuban, and 0.2% Nicaraguan.[15]
| Population reported at 2010 United States Census | |||||||||
|---|---|---|---|---|---|---|---|---|---|
Population |
American |
American |
Islander |
races |
more races |
or Latino (of any race) | |||
| Riverside County | 2,189,641 | 1,335,147 | 140,543 | 23,710 | 130,468 | 6,874 | 448,235 | 104,664 | 995,257 |
cities |
Population |
American |
American |
Islander |
races |
more races |
or Latino (of any race) | ||
| Banning | 29,603 | 19,164 | 2,165 | 641 | 1,549 | 39 | 4,604 | 1,441 | 12,181 |
| Beaumont | 36,877 | 23,163 | 2,276 | 544 | 2,845 | 83 | 6,058 | 1,908 | 14,864 |
| Blythe | 20,817 | 12,396 | 3,126 | 243 | 319 | 32 | 4,045 | 656 | 11,068 |
| Calimesa | 7,879 | 6,777 | 88 | 99 | 100 | 10 | 565 | 240 | 1,762 |
| Canyon Lake | 10,561 | 9,495 | 128 | 61 | 190 | 36 | 316 | 335 | 1,303 |
| Cathedral City | 51,200 | 32,537 | 1,344 | 540 | 2,562 | 55 | 12,008 | 2,154 | 30,085 |
| Coachella | 40,704 | 19,576 | 320 | 290 | 266 | 34 | 19,154 | 1,064 | 39,254 |
| Corona | 152,374 | 90,925 | 8,934 | 1,153 | 15,048 | 552 | 28,003 | 7,759 | 66,447 |
| Desert Hot Springs | 25,938 | 15,053 | 2,133 | 357 | 675 | 84 | 6,343 | 1,293 | 13,646 |
| Eastvale | 53,668 | 22,998 | 5,190 | 290 | 13,003 | 198 | 9,172 | 2,817 | 21,445 |
| Hemet | 78,657 | 53,259 | 5,049 | 1,223 | 2,352 | 284 | 12,371 | 4,119 | 28,150 |
| Indian Wells | 4,958 | 4,721 | 29 | 20 | 83 | 2 | 52 | 51 | 209 |
| Indio | 76,036 | 46,735 | 1,805 | 741 | 1,693 | 55 | 22,394 | 2,613 | 51,540 |
| La Quinta | 37,467 | 29,489 | 713 | 230 | 1,176 | 41 | 4,595 | 1,223 | 11,339 |
| Lake Elsinore | 51,821 | 31,067 | 2,738 | 483 | 2,996 | 174 | 11,174 | 3,189 | 25,073 |
| Menifee | 77,519 | 55,444 | 3,858 | 655 | 3,788 | 295 | 9,642 | 3,837 | 25,551 |
| Moreno Valley | 193,365 | 80,969 | 34,889 | 1,721 | 11,867 | 1,117 | 51,741 | 11,061 | 105,169 |
| Murrieta | 103,466 | 72,137 | 5,601 | 741 | 9,556 | 391 | 8,695 | 6,345 | 26,792 |
| Norco | 27,063 | 20,641 | 1,893 | 248 | 844 | 59 | 2,514 | 864 | 8,405 |
| Palm Desert | 48,445 | 39,957 | 875 | 249 | 1,647 | 55 | 4,427 | 1,235 | 11,038 |
| Palm Springs | 44,552 | 33,720 | 1,982 | 467 | 1,971 | 71 | 4,949 | 1,392 | 11,286 |
| Perris | 68,386 | 28,937 | 8,307 | 589 | 2,461 | 286 | 24,345 | 3,461 | 49,079 |
| Rancho Mirage | 17,218 | 15,267 | 256 | 94 | 651 | 14 | 598 | 338 | 1,964 |
| Riverside | 303,871 | 171,669 | 21,421 | 3,467 | 22,566 | 1,219 | 68,111 | 15,418 | 148,953 |
| San Jacinto | 44,199 | 25,272 | 2,928 | 812 | 1,341 | 124 | 11,208 | 2,514 | 23,109 |
| Temecula | 100,097 | 70,880 | 4,132 | 1,079 | 9,765 | 368 | 7,928 | 5,945 | 24,727 |
| Wildomar | 32,176 | 22,372 | 1,065 | 376 | 1,454 | 69 | 5,124 | 1,716 | 11,363 |
places |
Population |
American |
American |
Islander |
races |
more races |
or Latino (of any race) | ||
| Aguanga | 1,128 | 929 | 11 | 20 | 24 | 0 | 109 | 35 | 274 |
| Anza | 3,014 | 2,411 | 34 | 57 | 36 | 3 | 347 | 126 | 791 |
| Bermuda Dunes | 7,282 | 5,433 | 180 | 63 | 241 | 11 | 1,126 | 228 | 2,371 |
| Cabazon | 2,535 | 1,751 | 135 | 90 | 38 | 14 | 358 | 149 | 1,135 |
| Cherry Valley | 6,362 | 5,450 | 63 | 102 | 87 | 4 | 451 | 205 | 1,347 |
| Coronita | 2,608 | 1,649 | 38 | 31 | 108 | 12 | 688 | 82 | 1,349 |
| Crestmore Heights | 384 | 229 | 2 | 2 | 6 | 0 | 133 | 12 | 263 |
| Desert Center | 204 | 164 | 1 | 3 | 2 | 0 | 25 | 9 | 38 |
| Desert Edge | 3,822 | 3,051 | 14 | 34 | 28 | 1 | 624 | 70 | 1,220 |
| Desert Palms | 6,957 | 6,728 | 59 | 16 | 95 | 5 | 15 | 39 | 177 |
| East Hemet | 17,418 | 12,257 | 679 | 323 | 275 | 29 | 2,997 | 858 | 6,778 |
| El Cerrito | 5,100 | 3,542 | 91 | 54 | 95 | 11 | 1,122 | 185 | 2,657 |
| El Sobrante | 12,723 | 7,435 | 1,010 | 73 | 2,240 | 36 | 1,312 | 617 | 3,626 |
| French Valley | 23,067 | 14,827 | 1,828 | 229 | 2,672 | 134 | 1,889 | 1,488 | 6,318 |
| Garnet | 7,543 | 4,247 | 203 | 96 | 62 | 10 | 2,636 | 289 | 5,580 |
| Glen Avon | 20,199 | 10,272 | 805 | 216 | 462 | 34 | 7,567 | 843 | 13,766 |
| Good Hope | 9,192 | 4,156 | 669 | 98 | 64 | 4 | 3,885 | 316 | 7,319 |
| Green Acres | 1,805 | 1,192 | 34 | 41 | 25 | 2 | 396 | 115 | 856 |
| Highgrove | 3,988 | 2,104 | 162 | 41 | 113 | 13 | 1,388 | 167 | 2,604 |
| Home Gardens | 11,570 | 5,275 | 364 | 126 | 667 | 51 | 4,500 | 587 | 8,524 |
| Homeland | 5,969 | 3,727 | 130 | 85 | 49 | 15 | 1,673 | 290 | 3,110 |
| Idyllwild-Pine Cove | 3,874 | 3,434 | 32 | 30 | 135 | 6 | 88 | 149 | 479 |
| Indio Hills | 972 | 542 | 6 | 15 | 5 | 1 | 391 | 12 | 657 |
| Lake Mathews | 5,890 | 4,239 | 253 | 59 | 193 | 3 | 891 | 252 | 1,808 |
| Lake Riverside | 1,173 | 1,042 | 21 | 16 | 2 | 8 | 46 | 38 | 186 |
| Lakeland Village | 11,541 | 7,764 | 285 | 131 | 168 | 21 | 2,575 | 597 | 5,114 |
| Lakeview | 2,104 | 1,117 | 15 | 48 | 7 | 2 | 842 | 73 | 1,350 |
| March ARB | 1,159 | 811 | 171 | 10 | 35 | 2 | 93 | 37 | 172 |
| Mead Valley | 18,510 | 8,383 | 1,515 | 179 | 259 | 17 | 7,484 | 673 | 13,395 |
| Meadowbrook | 3,185 | 2,034 | 130 | 19 | 51 | 4 | 798 | 149 | 1,765 |
| Mecca | 8,577 | 2,686 | 40 | 47 | 17 | 7 | 5,543 | 237 | 8,462 |
| Mesa Verde | 1,023 | 589 | 8 | 9 | 4 | 1 | 373 | 39 | 715 |
| Mira Loma | 21,930 | 12,577 | 383 | 240 | 465 | 43 | 7,250 | 972 | 14,846 |
| Mountain Center | 63 | 60 | 0 | 1 | 1 | 0 | 0 | 1 | 15 |
| North Shore | 3,477 | 1,394 | 33 | 26 | 18 | 5 | 1,884 | 117 | 3,313 |
| Nuevo | 6,447 | 4,011 | 113 | 91 | 82 | 16 | 1,810 | 324 | 3,514 |
| Oasis | 6,890 | 1,693 | 22 | 96 | 42 | 0 | 4,927 | 110 | 6,731 |
| Pedley | 12,672 | 7,509 | 381 | 119 | 554 | 48 | 3,520 | 541 | 6,773 |
| Ripley | 692 | 393 | 103 | 2 | 1 | 4 | 165 | 24 | 537 |
| Romoland | 1,684 | 958 | 65 | 8 | 35 | 12 | 514 | 92 | 865 |
| Rubidoux | 34,280 | 16,935 | 1,850 | 391 | 855 | 136 | 12,469 | 1,644 | 23,322 |
| Sky Valley | 2,406 | 1,961 | 35 | 34 | 21 | 3 | 282 | 70 | 682 |
| Sunnyslope | 5,153 | 3,017 | 96 | 55 | 76 | 10 | 1,696 | 203 | 3,630 |
| Temescal Valley | 22,535 | 14,785 | 1,507 | 131 | 2,157 | 74 | 2,565 | 1,316 | 6,753 |
| Thermal | 2,865 | 1,034 | 28 | 30 | 32 | 1 | 1,685 | 55 | 2,730 |
| Thousand Palms | 7,715 | 5,763 | 105 | 75 | 129 | 10 | 1,422 | 211 | 4,051 |
| Valle Vista | 14,578 | 11,542 | 440 | 252 | 283 | 41 | 1,351 | 669 | 4,027 |
| Vista Santa Rosa | 2,926 | 1,699 | 8 | 140 | 6 | 0 | 942 | 131 | 2,487 |
| Warm Springs | 2,676 | 1,673 | 119 | 24 | 102 | 14 | 606 | 138 | 1,232 |
| Whitewater | 859 | 636 | 37 | 31 | 21 | 0 | 97 | 37 | 267 |
| Winchester | 2,534 | 1,577 | 38 | 17 | 46 | 2 | 728 | 126 | 1,233 |
| Woodcrest | 14,347 | 10,418 | 716 | 69 | 715 | 41 | 1,716 | 672 | 4,113 |
communities |
Population |
American |
American |
Islander |
races |
more races |
or Latino (of any race) | ||
| All others not CDPs (combined) | 73,117 | 51,422 | 2,231 | 2,102 | 3,794 | 206 | 10,105 | 3,257 | 24,128 |
2000
As of the census[16] of 2000, there were 1,545,387 people, 506,218 households, and 372,576 families residing in the county. The population density was 214 people per square mile (83/km²). There were 584,674 housing units at an average density of 81 per square mile (31/km²). The racial makeup of the county was 65.6% White, 6.2% Black or African American, 1.2% Native American, 3.7% Asian, 0.3% Pacific Islander, 18.7% from other races, and 4.4% from two or more races. 36.2% of the population were Hispanic or Latino of any race. 9.2% were of German, 6.9% English, 6.1% Irish and 5.0% American ancestry according to Census 2000. 67.2% spoke English and 27.7% Spanish as their first language.
In 2006 the county had a population of 2,026,803, up 31.2% since 2000. In 2005 45.8% of the population was non-Hispanic whites. The percentages of African Americans, Asians and Native Americans remained relatively similar to their 2000 figures. The percentage of Pacific Islanders had majorly risen to 0.4. Hispanics now constituted 41% of the population.
There were 506,218 households out of which 38.90% had children under the age of 18 living with them, 56.5% were married couples living together, 12.0% had a female householder with no husband present, and 26.4% were non-families. 20.7% of all households were made up of individuals and 9.3% had someone living alone who was 65 years of age or older. The average household size was 3.0 and the average family size was 3.5.
In the county the population was spread out with 30.3% under the age of 18, 9.2% from 18 to 24, 28.9% from 25 to 44, 18.9% from 45 to 64, and 12.7% who were 65 years of age or older. The median age was 33 years. For every 100 females there were 99.1 males. For every 100 females age 18 and over, there were 96.8 males.
The median income for a household in the county was $42,887, and the median income for a family was $48,409. Males had a median income of $38,639 versus $28,032 for females. The per capita income for the county was $18,689. About 10.7% of families and 14.2% of the population were below the poverty line, including 18.5% of those under age 18 and 7.6% of those age 65 or over.
Education
Universities and colleges
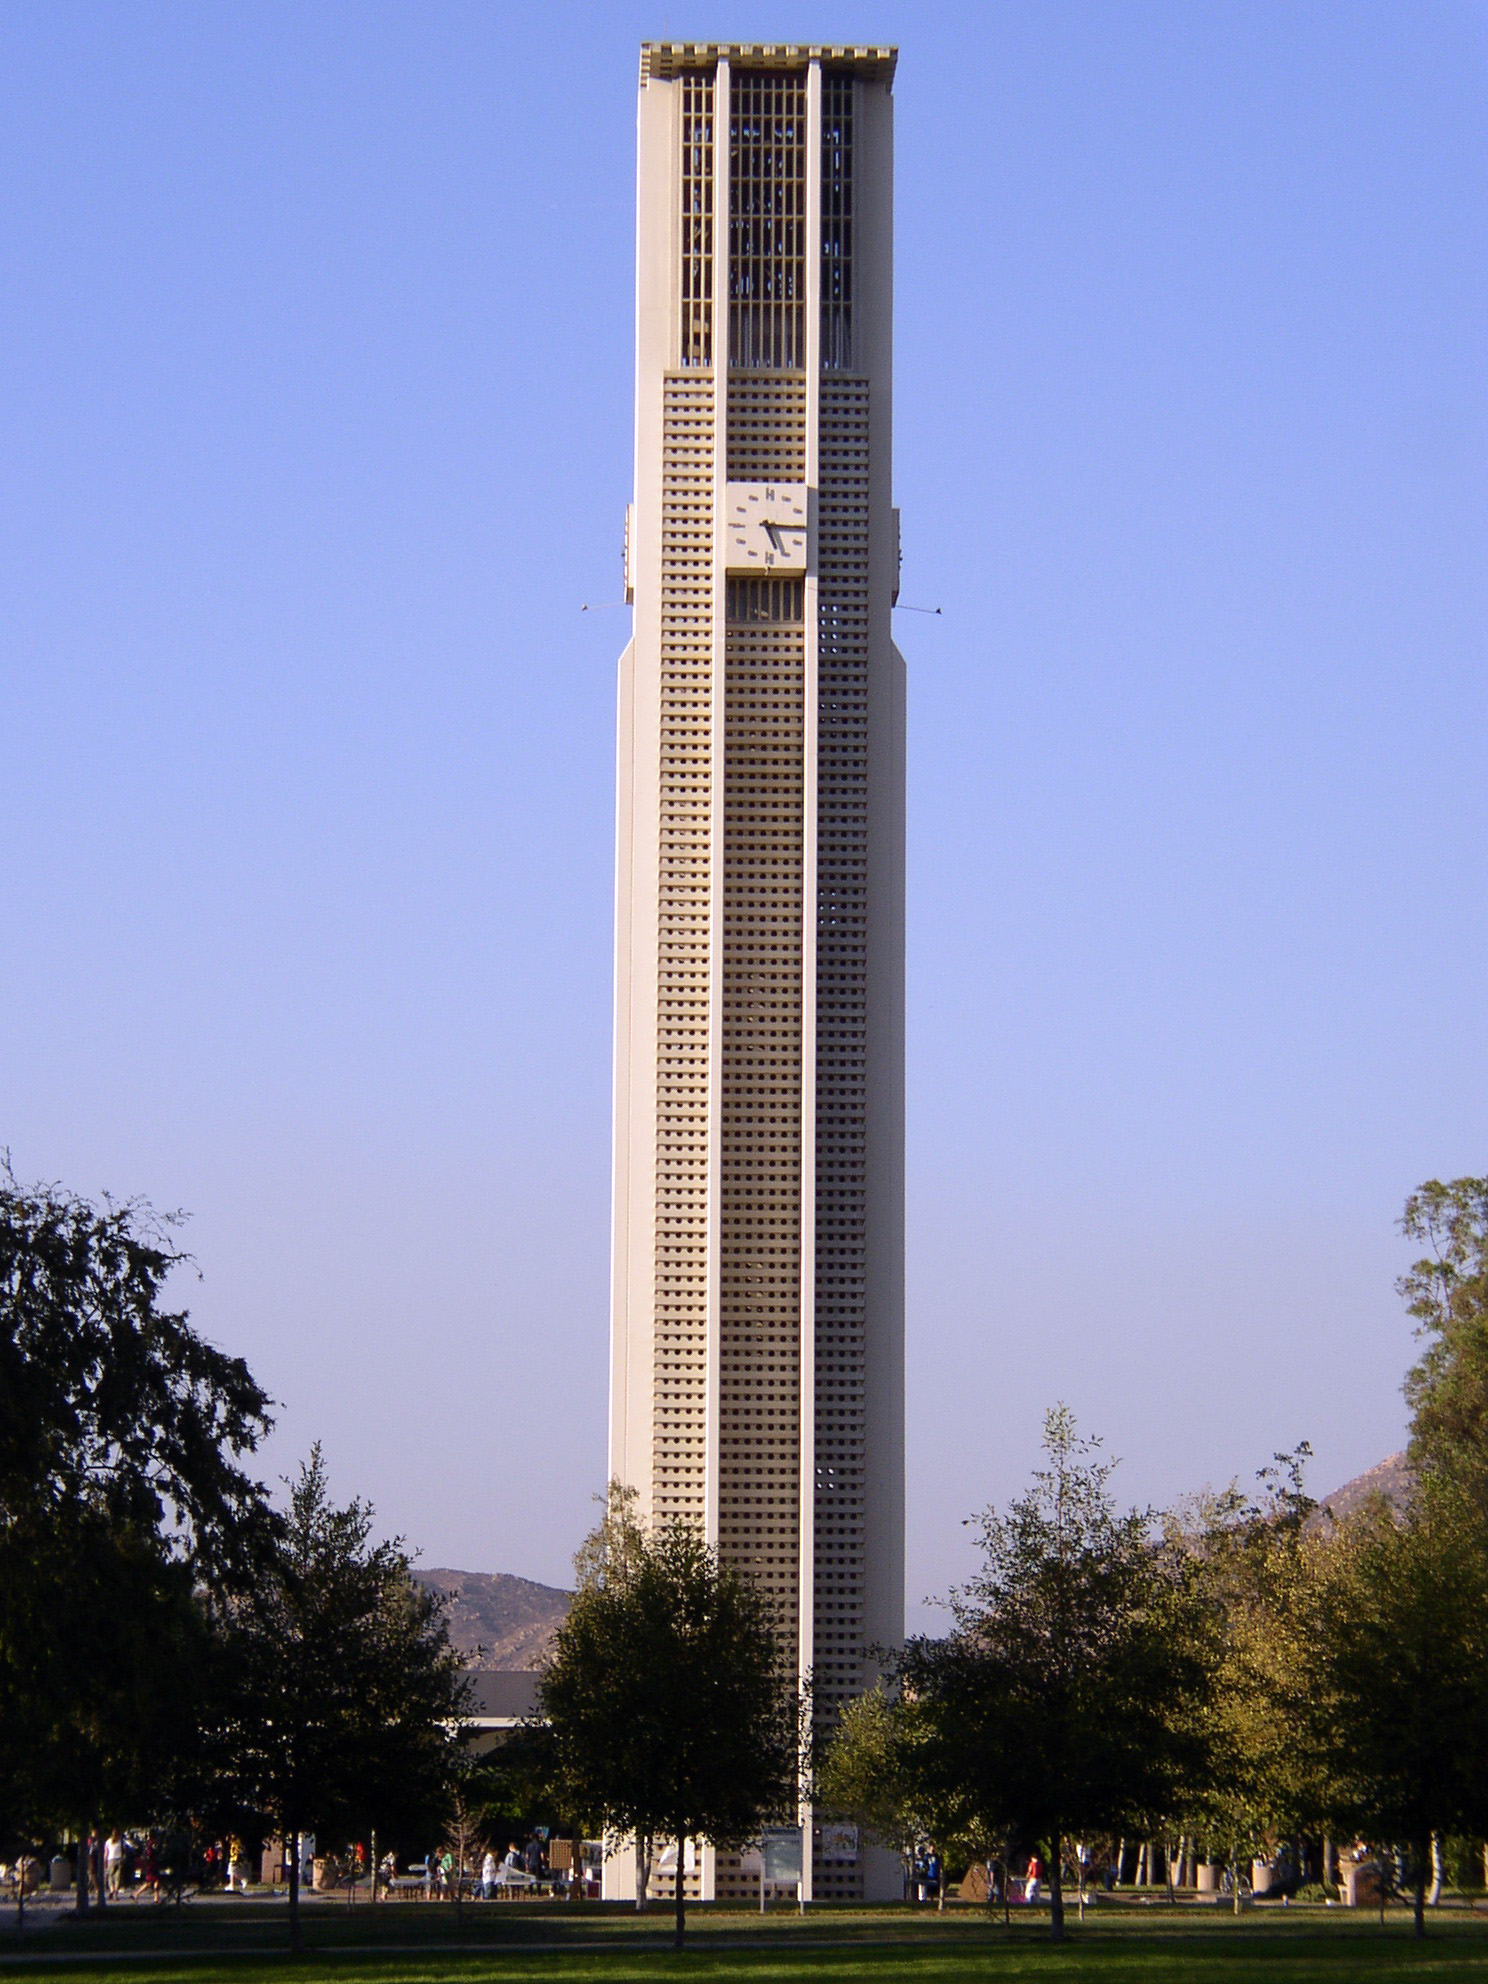

The 161-foot, 48-bell, carillon tower at the University of California, Riverside.
- Brandman University, part of the Chapman University System[17] -- Moreno Valley, Palm Desert, Temecula
- California Baptist University[18] -- Riverside
- California Southern Law School[19] -- Riverside
- California State University, San Bernardino, Palm Desert Campus[20] -- Palm Desert
- College of the Desert[21] -- Palm Desert
- La Sierra University[22] -- Riverside
- Mayfield College[23] -- Cathedral City
- Mt. San Jacinto College[24] -- Banning, Menifee, San Jacinto, Temecula
- Palo Verde College[25] -- Blythe
- Riverside Community College[26] -- Moreno Valley, Norco, Riverside
- Santa Barbara Business College[27] -- Palm Desert
- University of California, Riverside[28] -- Palm Desert, Riverside
- University of Phoenix[29] -- Murrieta, Palm Desert
Military installations
- Chocolate Mountain Aerial Gunnery Range
- March Air Reserve Base
- Naval Surface Warfare Center, Corona Division
Places of interest


The Golden Era Productions entrance at Gold Base, with a protester
Gold Base, in an unincorporated area in the county, is the international headquarters of the Church of Scientology. The compound includes the studios of Golden Era Productions.[30][31][32][33] Other sites include:
- California Citrus State Historic Park
- Jensen Alvarado Ranch
- Lake Perris State Recreation Area
- Living Desert Zoo and Gardens
- March Field Air Museum
- Mission Inn
- Mount San Jacinto State Park
- Orange Empire Railway Museum
- Orocopia Mountains Wilderness
- Palm Springs Desert Museum
- Santa Rosa Plateau
- Temecula Valley AVA Wine Region
- Western Science Center
- National Register of Historic Places listings in Riverside County, California
References
Bibliography
- Fitch, Robert J. Profile of a Century: Riverside County, California, 1893-1993. Riverside County Historical Commission Press, 1993.
References and notes
- ^ Native American Indian Resources web site; Federally Recognized California Tribes.
- ^ a b Fitch, pages v-viii.
- ^ California v. Cabazon Band, 480 U.S. 202 (1987).
- ^ "Census 2000 U.S. Gazetteer Files: Counties". United States Census. http://www.census.gov/tiger/tms/gazetteer/county2k.txt. Retrieved 2011-02-13.
- ^ a b Husing, John (October 2007). "Inland Empire City Profile 2007" (PDF). Inland Empire Quarterly Economic Report 19 (4). Retrieved on 2007-12-01.
- ^ C. Michael Hogan. 2008 Blue Oak: Quercus douglasii, GlobalTwitcher.com, ed. N. Stromberg
- ^ http://www.pe.com/localnews/riverside/stories/PE_News_Local_D_faa06.2f43b1a.html
- ^ http://www.pe.com/localnews/inland/stories/PE_News_Local_D_planes08.406df4b.html
- ^ Fitch, page 1.
- ^ General Plan for Riverside County, Earth Metrics Inc., Burlingame, Ca. (1994)
- ^ Locations
- ^ Rededication of the Historic Riverside County Courthouse
- ^ California Courts - Main Courthouse
- ^ http://media.photobucket.com/image/1932%20election%20map/rarohla/1932PresidentialElectionMap.png
- ^ "2010 Census P.L. 94-171 Summary File Data". United States Census Bureau. http://www2.census.gov/census_2010/01-Redistricting_File--PL_94-171/California/.
- ^ "American FactFinder". United States Census Bureau. http://factfinder.census.gov. Retrieved 2008-01-31.
- ^ About Brandman University
- ^ California Baptist Univ. About
- ^ California Southern Law School
- ^ CSUSB Palm Desert Campus
- ^ About College of the Desert
- ^ La Sierra University
- ^ Mayfield College
- ^ Mt. San Jacinto College
- ^ Palo Verde College
- ^ Riverside Community College District
- ^ Santa Barbara Business College
- ^ University of California, Riverside
- ^ University of Phoenix locations
- ^ "Rural Studio is Scientology Headquarters." San Jose Mercury News. August 13, 1991. 6B California News. Retrieved on October 21, 2009.
- ^ Kelly, David. "Scientology foes blast new Riverside County law." Los Angeles Times. January 10, 2009. 1. Retrieved on October 21, 2009.
- ^ Glick, Julia. "County ordinance raises questions about Scientology." The Press-Enterprise. Tuesday January 6, 2009. Retrieved on October 21, 2009.
- ^ McGavin, Gregor. "Scientologists' presence in Inland area dates back to 1960s." The Press-Enterprise. Tuesday January 15, 2008. Retrieved on October 21, 2009.
Sources
- California Department of Health Services
- County of Riverside General Plan (2004).
- US Department of Education, National Center for Educational Statistics
- US Department of Transportation, Federal Aviation Administration
External links
- Official Riverside County website
- Official Riverside County, Department of Information Technology website
- Official Riverside County Sheriff website
- Official Riverside County Fire Dept. web site
- Official Riverside County District Attorney's Office web site
- Official Riverside County Regional Parks District web site
- SanJacintoValley.info Information for residents and visitors of Hemet and San Jacinto located in San Jacinto Valley, California.
- Western Science Center
- History of San Bernardino and Riverside Counties, Volume 1.
- History of San Bernardino and Riverside Counties, Volume 2.
- History of San Bernardino and Riverside Counties Volume 3.

|
San Bernardino County |
| ||
| Orange County | La Paz County, Arizona | |||
 Riverside County, California | ||||
| San Diego County and Imperial County |
| |||||||||||||||||||||||

| |||||||||||||||||||||||||||
| |||||||||||||||||||||||
| |||||||||||||||||||||||
| This page uses content from the English language Wikipedia. The original content was at Riverside County, California. The list of authors can be seen in the page history. As with this Familypedia wiki, the content of Wikipedia is available under the Creative Commons License. |