| ||||||||||||||
| Pocahontas County, Iowa | |
 County Courthouse
| |
 Location in the state of Iowa | |
 Iowa's location in the U.S. | |
| Founded | 1851 |
|---|---|
| Named for | Pocahontas |
| Seat | Pocahontas |
| Largest city | Pocahontas |
| Area - Total - Land - Water |
579 sq mi (1,500 km²) 577 sq mi (1,494 km²) 1.4 sq mi (4 km²), 0.2 |
| Population - (2020) - Density |
7,078 |
| Congressional district | 4th |
| Time zone | Central: UTC-6/-5 |
| Website | https://pocahontascounty.iowa.gov/ |
Pocahontas County is a county located in Iowa, United States. As of the 2020 census the population was 7,078, making it the state's ninth-least populous county.[1] The county seat is Pocahontas.[2] The county was formed in 1851.[3]
This county was named after Pocahontas, the famous Native American woman from Jamestown, Virginia. A colossal statue of her stands in the city.[3]
Geography[]
According to the U.S. Census Bureau, the county has a total area of 579 square miles (1,500 km2), of which 577 square miles (1,490 km2) is land and 1.4 square miles (3.6 km2) (0.2%) is water.[4]
Major highways[]
 Iowa Highway 3
- Iowa Highway 4
- Iowa Highway 7
- Iowa Highway 10
- Iowa Highway 15
Adjacent counties[]
- Palo Alto County (north)
- Humboldt County (east)
- Webster County (southeast)
- Calhoun County (south)
- Buena Vista County (west)
Demographics[]
| Historical populations | |||
|---|---|---|---|
| Census | Pop. | %± | |
| 1860 | 103 | ||
| 1870 | 1,446 | 1,303.9% | |
| 1880 | 3,713 | 156.8% | |
| 1890 | 9,553 | 157.3% | |
| 1900 | 15,339 | 60.6% | |
| 1910 | 14,808 | −3.5% | |
| 1920 | 15,602 | 5.4% | |
| 1930 | 15,687 | 0.5% | |
| 1940 | 16,266 | 3.7% | |
| 1950 | 15,496 | −4.7% | |
| 1960 | 14,234 | −8.1% | |
| 1970 | 12,729 | −10.6% | |
| 1980 | 11,369 | −10.7% | |
| 1990 | 9,525 | −16.2% | |
| 2000 | 8,662 | −9.1% | |
| 2010 | 7,310 | −15.6% | |
| U.S. Decennial Census[5] 1790-1960[6] 1900-1990[7] 1990-2000[8] 2010-2020[9] | |||
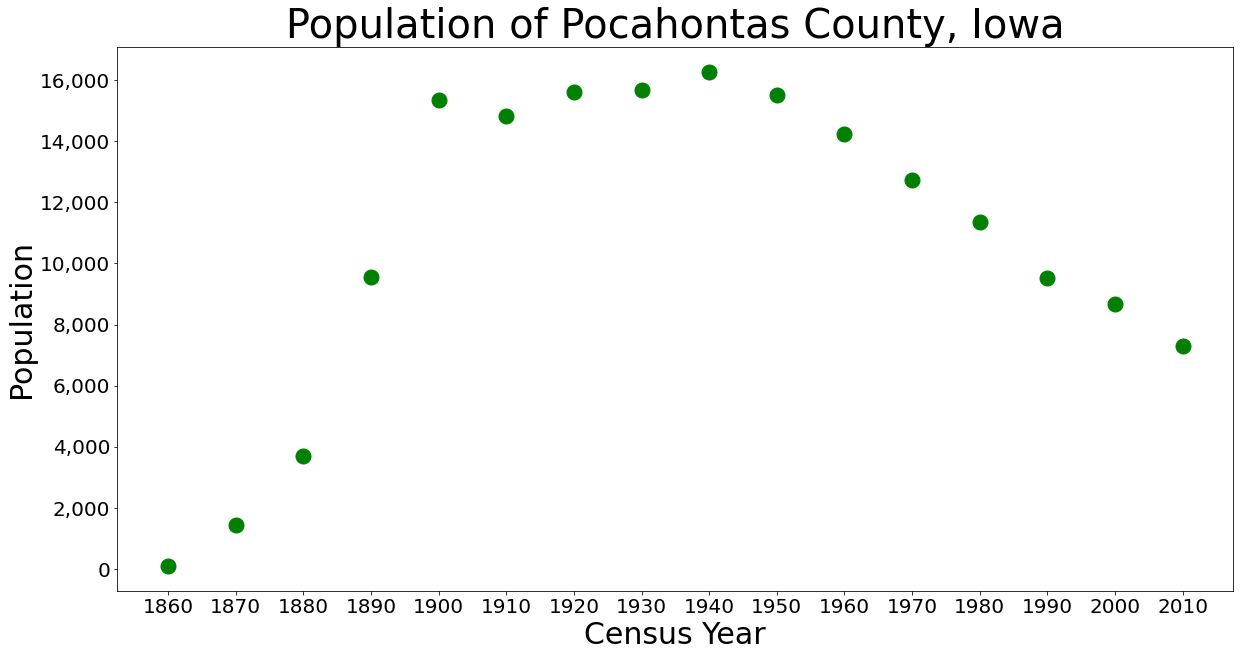

Population of Pocahontas County from US census data
2020 census[]
The 2020 census recorded a population of 7,078 in the county, with a population density of 12.2213/sq mi (4.7187/km2). 95.79% of the population reported being of one race. There were 3,666 housing units, of which 3,090 were occupied.[1]
| Race | Num. | Perc. |
|---|---|---|
| White (NH) | 6,383 | 90.2% |
| Black or African American (NH) | 66 | 0.9% |
| Native American (NH) | 10 | 0.14% |
| Asian (NH) | 29 | 0.41% |
| Pacific Islander (NH) | 23 | 0.32% |
| Other/Mixed (NH) | 213 | 3% |
| Hispanic or Latino | 354 | 5% |
2010 census[]
The 2010 census recorded a population of 7,310 in the county, with a population density of 12.654/sq mi (4.886/km2). There were 3,794 housing units, of which 3,233 were occupied.[11]
2000 census[]


2000 Census Age Pyramid for Pocahontas County
As of the census[12] of 2000, there were 8,662 people, 3,617 households, and 2,430 families residing in the county. The population density was 15 people per square mile (6/km2). There were 3,988 housing units at an average density of 7 per square mile (3/km2). The racial makeup of the county was 98.49% White, 0.24% Black or African American, 0.17% Native American, 0.17% Asian, 0.01% Pacific Islander, 0.30% from other races, and 0.61% from two or more races. 0.89% of the population were Hispanic or Latino of any race.
There were 3,617 households, out of which 29.50% had children under the age of 18 living with them, 58.30% were married couples living together, 5.90% had a female householder with no husband present, and 32.80% were non-families. 30.20% of all households were made up of individuals, and 17.80% had someone living alone who was 65 years of age or older. The average household size was 2.35 and the average family size was 2.91.
In the county, the population was spread out, with 25.40% under the age of 18, 5.30% from 18 to 24, 23.40% from 25 to 44, 24.10% from 45 to 64, and 21.70% who were 65 years of age or older. The median age was 42 years. For every 100 females there were 96.60 males. For every 100 females age 18 and over, there were 93.20 males.
The median income for a household in the county was $33,362, and the median income for a family was $40,568. Males had a median income of $27,929 versus $20,515 for females. The per capita income for the county was $17,006. About 6.60% of families and 9.10% of the population were below the poverty line, including 12.30% of those under age 18 and 6.50% of those age 65 or over.
Communities[]
Cities[]
- Fonda
- Gilmore City
- Havelock
- Laurens
- Palmer
- Plover
- Pocahontas
- Rolfe
- Varina
Unincorporated communities[]
- Ware
Townships[]
- Bellville
- Cedar
- Center
- Colfax
- Cummins
- Des Moines
- Dover
- Garfield
- Grant
- Lake
- Lincoln
- Lizard
- Marshall
- Powhatan
- Roosevelt
- Sherman
- Swan Lake
Population ranking[]
The population ranking of the following table is based on the 2020 census of Pocahontas County.[1]
† county seat
| Rank | City/Town/etc. | Municipal type | Population (2020 Census) |
|---|---|---|---|
| 1 | † Pocahontas | City | 1,867 |
| 2 | Laurens | City | 1,264 |
| 3 | Fonda | City | 636 |
| 4 | Rolfe | City | 509 |
| 5 | Gilmore City (partially in Humboldt County) | City | 217 (487 total) |
| 6 | Palmer | City | 138 |
| 7 | Havelock | City | 130 |
| 8 | Varina | City | 68 |
| 9 | Plover | City | 50 |
Politics[]
| Year | Republican | Democratic | Third party | |||
|---|---|---|---|---|---|---|
| No. | % | No. | % | No. | % | |
| 2020 | 2,826 | 73.92% | 933 | 24.40% | 64 | 1.67% |
| 2016 | 2,702 | 69.91% | 963 | 24.92% | 200 | 5.17% |
| 2012 | 2,396 | 59.42% | 1,523 | 37.77% | 113 | 2.80% |
| 2008 | 2,138 | 53.29% | 1,800 | 44.87% | 74 | 1.84% |
| 2004 | 2,441 | 56.60% | 1,822 | 42.24% | 50 | 1.16% |
| 2000 | 2,242 | 54.14% | 1,736 | 41.92% | 163 | 3.94% |
| 1996 | 1,707 | 40.50% | 1,981 | 47.00% | 527 | 12.50% |
| 1992 | 1,743 | 37.33% | 1,919 | 41.10% | 1,007 | 21.57% |
| 1988 | 1,871 | 40.22% | 2,722 | 58.51% | 59 | 1.27% |
| 1984 | 2,627 | 50.64% | 2,481 | 47.82% | 80 | 1.54% |
| 1980 | 3,194 | 56.17% | 1,959 | 34.45% | 533 | 9.37% |
| 1976 | 2,700 | 45.85% | 3,055 | 51.88% | 134 | 2.28% |
| 1972 | 3,138 | 57.19% | 2,241 | 40.84% | 108 | 1.97% |
| 1968 | 2,940 | 52.56% | 2,364 | 42.26% | 290 | 5.18% |
| 1964 | 2,079 | 34.24% | 3,988 | 65.68% | 5 | 0.08% |
| 1960 | 3,445 | 50.23% | 3,408 | 49.69% | 6 | 0.09% |
| 1956 | 3,606 | 52.89% | 3,201 | 46.95% | 11 | 0.16% |
| 1952 | 4,472 | 61.73% | 2,517 | 34.74% | 256 | 3.53% |
| 1948 | 2,397 | 39.61% | 3,500 | 57.84% | 154 | 2.55% |
| 1944 | 2,600 | 41.94% | 3,577 | 57.70% | 22 | 0.35% |
| 1940 | 2,985 | 41.92% | 4,118 | 57.83% | 18 | 0.25% |
| 1936 | 2,277 | 33.39% | 4,357 | 63.89% | 185 | 2.71% |
| 1932 | 1,800 | 28.48% | 4,245 | 67.16% | 276 | 4.37% |
| 1928 | 3,322 | 53.75% | 2,824 | 45.70% | 34 | 0.55% |
| 1924 | 2,537 | 39.65% | 819 | 12.80% | 3,042 | 47.55% |
| 1920 | 4,046 | 70.07% | 1,639 | 28.39% | 89 | 1.54% |
| 1916 | 1,808 | 51.29% | 1,658 | 47.04% | 59 | 1.67% |
| 1912 | 760 | 22.95% | 1,176 | 35.52% | 1,375 | 41.53% |
| 1908 | 1,857 | 57.42% | 1,315 | 40.66% | 62 | 1.92% |
| 1904 | 2,175 | 66.09% | 976 | 29.66% | 140 | 4.25% |
| 1900 | 2,176 | 61.84% | 1,287 | 36.57% | 56 | 1.59% |
| 1896 | 1,866 | 56.82% | 1,377 | 41.93% | 41 | 1.25% |
| 1892 | 1,304 | 51.89% | 939 | 37.37% | 270 | 10.74% |
| 1888 | 999 | 55.72% | 746 | 41.61% | 48 | 2.68% |
| 1884 | 774 | 60.90% | 497 | 39.10% | 0 | 0.00% |
| 1880 | 463 | 66.71% | 214 | 30.84% | 17 | 2.45% |
See also[]
- Pocahontas County Courthouse
- National Register of Historic Places listings in Pocahontas County, Iowa
- Manson crater
References[]
- ^ a b c "2020 Census State Redistricting Data". United states Census Bureau. https://www2.census.gov/programs-surveys/decennial/2020/data/01-Redistricting_File--PL_94-171/Iowa/.
- ^ "Find a County". National Association of Counties. http://www.naco.org/Counties/Pages/FindACounty.aspx.
- ^ a b History Archived 2010-10-21 at the Wayback Machine, Pocahontas County Economic Development.
- ^ "US Gazetteer files: 2010, 2000, and 1990". United States Census Bureau. 2011-02-12. https://www.census.gov/geographies/reference-files/time-series/geo/gazetteer-files.html.
- ^ "U.S. Decennial Census". United States Census Bureau. https://www.census.gov/programs-surveys/decennial-census.html.
- ^ "Historical Census Browser". University of Virginia Library. http://mapserver.lib.virginia.edu.
- ^ "Population of Counties by Decennial Census: 1900 to 1990". United States Census Bureau. https://www.census.gov/population/cencounts/ia190090.txt.
- ^ "Census 2000 PHC-T-4. Ranking Tables for Counties: 1990 and 2000". United States Census Bureau. https://www.census.gov/population/www/cen2000/briefs/phc-t4/tables/tab02.pdf.
- ^ "State & County QuickFacts". United States Census Bureau. http://quickfacts.census.gov/qfd/states/19/19151.html.
- ^ "P2 HISPANIC OR LATINO, AND NOT HISPANIC OR LATINO BY RACE – 2020: DEC Redistricting Data (PL 94-171) – Pocahontas County, Iowa". https://data.census.gov/cedsci/table?q=Pocahontas%20County,%20Iowa&t=Race%20and%20Ethnicity&tid=DECENNIALPL2020.P2.
- ^ "Iowa:2010 Population & Housing Occupancy Status". United States Census Bureau. https://www2.census.gov/library/publications/decennial/2010/cph-2/cph-2-17.pdf.
- ^ "U.S. Census website". United States Census Bureau. https://www.census.gov.
- ^ Leip, David. "Dave Leip's Atlas of U.S. Presidential Elections". http://uselectionatlas.org/RESULTS.
External links[]
- Pocahontas County Economic Development Commission
- "Pocahontas. II. A N. W. county of Iowa". The American Cyclopædia. 1879.
- The Pioneer History of Pocahontas County, Iowa (1902), a county history by Robert E. Flickinger

|
Palo Alto County |
| ||
| Buena Vista County | Humboldt County | |||
 Pocahontas County, Iowa | ||||
| Calhoun County | Webster County |
| |||||||||||
|
| This page uses content from the English language Wikipedia. The original content was at Pocahontas County, Iowa. The list of authors can be seen in the page history. As with this Familypedia wiki, the content of Wikipedia is available under the Creative Commons License. |