| ||||||||||||||
| Jim Hogg County, Texas | |
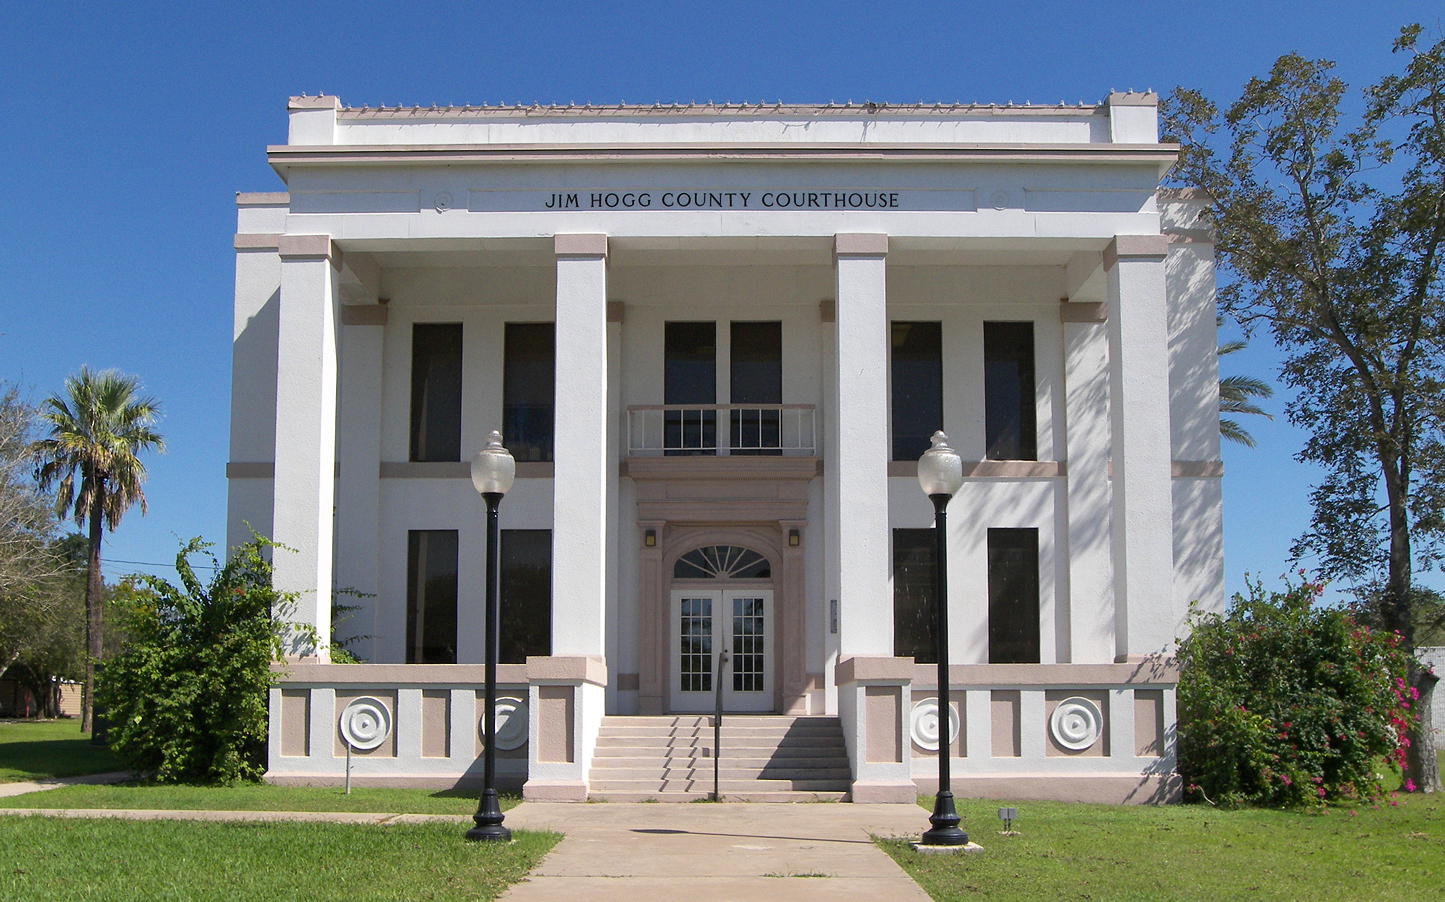 The Jim Hogg County Courthouse in Hebbronville
| |
 Location in the state of Texas | |
 Texas's location in the U.S. | |
| Founded | 1913 |
|---|---|
| Named for | James Stephen Hogg |
| Seat | Hebbronville |
| Largest community | Hebbronville |
| Area - Total - Land - Water |
1,136 sq mi (2,942 km²) 1,136 sq mi (2,942 km²) 0.04 sq mi (0 km²), 0% |
| Population - (2010) - Density |
5,300 4.7/sq mi (2/km²) |
| Congressional district | 15th |
| Time zone | Central: UTC-6/-5 |
| Website | http://jimhoggcounty.net/ |


Jim Hogg County Library is located near the courthouse.
Jim Hogg County is a county located in the U.S. state of Texas. As of the 2010 census, the population was 5,300.[1] Its county seat is Hebbronville.[2] The county is named for James Stephen Hogg, the governor of Texas from 1891 to 1895.
History[]
Jim Hogg County was formed in 1913 from portions of Brooks and Duval counties. It was named after Jim Hogg, the 21st Governor of Texas, and the first governor born in the state of Texas.
Geography[]
According to the U.S. Census Bureau, the county has a total area of 1,136 square miles (2,940 km2), virtually all of which is land.[3]
Major highways[]
 State Highway 16
- State Highway 285
- Farm to Market Road 1017
Adjacent counties[]
- Duval County (north)
- Brooks County (east)
- Starr County (south)
- Zapata County (west)
- Webb County (northwest)
Demographics[]
| Historical populations | |||
|---|---|---|---|
| Census | Pop. | %± | |
| 1920 | 1,914 | ||
| 1930 | 4,919 | 157.0% | |
| 1940 | 5,449 | 10.8% | |
| 1950 | 5,389 | −1.1% | |
| 1960 | 5,022 | −6.8% | |
| 1970 | 4,654 | −7.3% | |
| 1980 | 5,168 | 11.0% | |
| 1990 | 5,109 | −1.1% | |
| 2000 | 5,281 | 3.4% | |
| 2010 | 5,300 | 0.4% | |
| Est. 2016 | 5,146 | [4] | −2.6% |
| U.S. Decennial Census[5] 1850–2010[6] 2010–2014[1] | |||
As of the census[7] of 2000, there were 5,281 people, 1,815 households, and 1,359 families residing in the county. The population density was 5 people per square mile (2/km²). There were 2,308 housing units at an average density of 2 per square mile (1/km²). The racial makeup of the county was 80.44% White, 0.45% Black or African American, 0.78% Native American, 0.21% Asian, 15.83% from other races, and 2.29% from two or more races. 89.98% of the population were Hispanic or Latino of any race.
There were 1,815 households out of which 38.50% had children under the age of 18 living with them, 55.20% were married couples living together, 14.60% had a female householder with no husband present, and 25.10% were non-families. 23.40% of all households were made up of individuals and 12.30% had someone living alone who was 65 years of age or older. The average household size was 2.89 and the average family size was 3.43.
In the county, the population was spread out with 31.60% under the age of 18, 8.10% from 18 to 24, 24.60% from 25 to 44, 21.10% from 45 to 64, and 14.60% who were 65 years of age or older. The median age was 34 years. For every 100 females there were 96.70 males. For every 100 females age 18 and over, there were 92.10 males.
The median income for a household in the county was $25,833, and the median income for a family was $29,844. Males had a median income of $28,150 versus $18,750 for females. The per capita income for the county was $12,185. About 24.20% of families and 25.90% of the population were below the poverty line, including 29.80% of those under age 18 and 30.20% of those age 65 or over.
Politics[]
| Year | Republican | Democratic | Third Parties |
|---|---|---|---|
| 2016 | 20.3% 430 | 77.2% 1,635 | 2.6% 54 |
| 2012 | 21.4% 356 | 78.0% 1,301 | 0.6% 10 |
| 2008 | 26.0% 472 | 73.6% 1,336 | 0.4% 7 |
| 2004 | 34.5% 712 | 65.1% 1,344 | 0.4% 9 |
| 2000 | 28.9% 623 | 70.1% 1,512 | 1.0% 22 |
| 1996 | 16.9% 307 | 79.3% 1,437 | 3.8% 68 |
| 1992 | 22.7% 478 | 72.0% 1,520 | 5.3% 112 |
| 1988 | 23.8% 510 | 76.1% 1,630 | 0.1% 3 |
| 1984 | 26.3% 608 | 73.6% 1,703 | 0.1% 2 |
| 1980 | 26.8% 535 | 72.0% 1,437 | 1.3% 25 |
| 1976 | 20.7% 429 | 79.3% 1,645 | |
| 1972 | 47.3% 765 | 52.4% 848 | 0.3% 5 |
| 1968 | 14.3% 223 | 82.1% 1,276 | 3.6% 56 |
| 1964 | 9.9% 152 | 89.9% 1,375 | 0.2% 3 |
| 1960 | 15.2% 224 | 84.9% 1,255 | |
| 1956 | 31.1% 282 | 68.1% 617 | 0.8% 7 |
| 1952 | 22.7% 309 | 77.3% 1,053 | |
| 1948 | 8.8% 73 | 87.5% 725 | 3.7% 31 |
| 1944 | 10.8% 77 | 87.0% 620 | 2.2% 16 |
| 1940 | 11.0% 100 | 89.0% 810 | |
| 1936 | 6.3% 48 | 93.7% 712 | |
| 1932 | 10.7% 51 | 89.4% 428 | |
| 1928 | 29.3% 109 | 70.7% 263 | |
| 1924 | 12.0% 19 | 88.0% 139 | |
| 1920 | 24.7% 23 | 75.3% 70 | |
| 1916 | 5.6% 11 | 94.4% 187 |
The county is historically Democratic. Since the county was founded in 1913, every Democratic candidate has carried the county. Over the entire nation only Brooks County, Texas can make a similar claim since its foundation, and only neighbouring Starr and Duval Counties plus Northampton County, North Carolina also possess this distinction in elections since Jim Hogg County was founded.[9] The Democratic candidate has consistently received more than 65 percent of the county's vote since, at least, 1992.[10] Jim Hogg was one of the few counties in Texas that voted for Senator John Kerry of Massachusetts over the incumbent George W. Bush. Kerry won by almost a 2-to-1 majority. He received 1,344 votes while Bush only received 712 votes.
From 1981-1988, the district attorney for Jim Hogg County was noted Laredo lawyer Julio A. Garcia. The district then included Webb, Dimmit, Zapata, and Jim Hogg counties.
Education[]
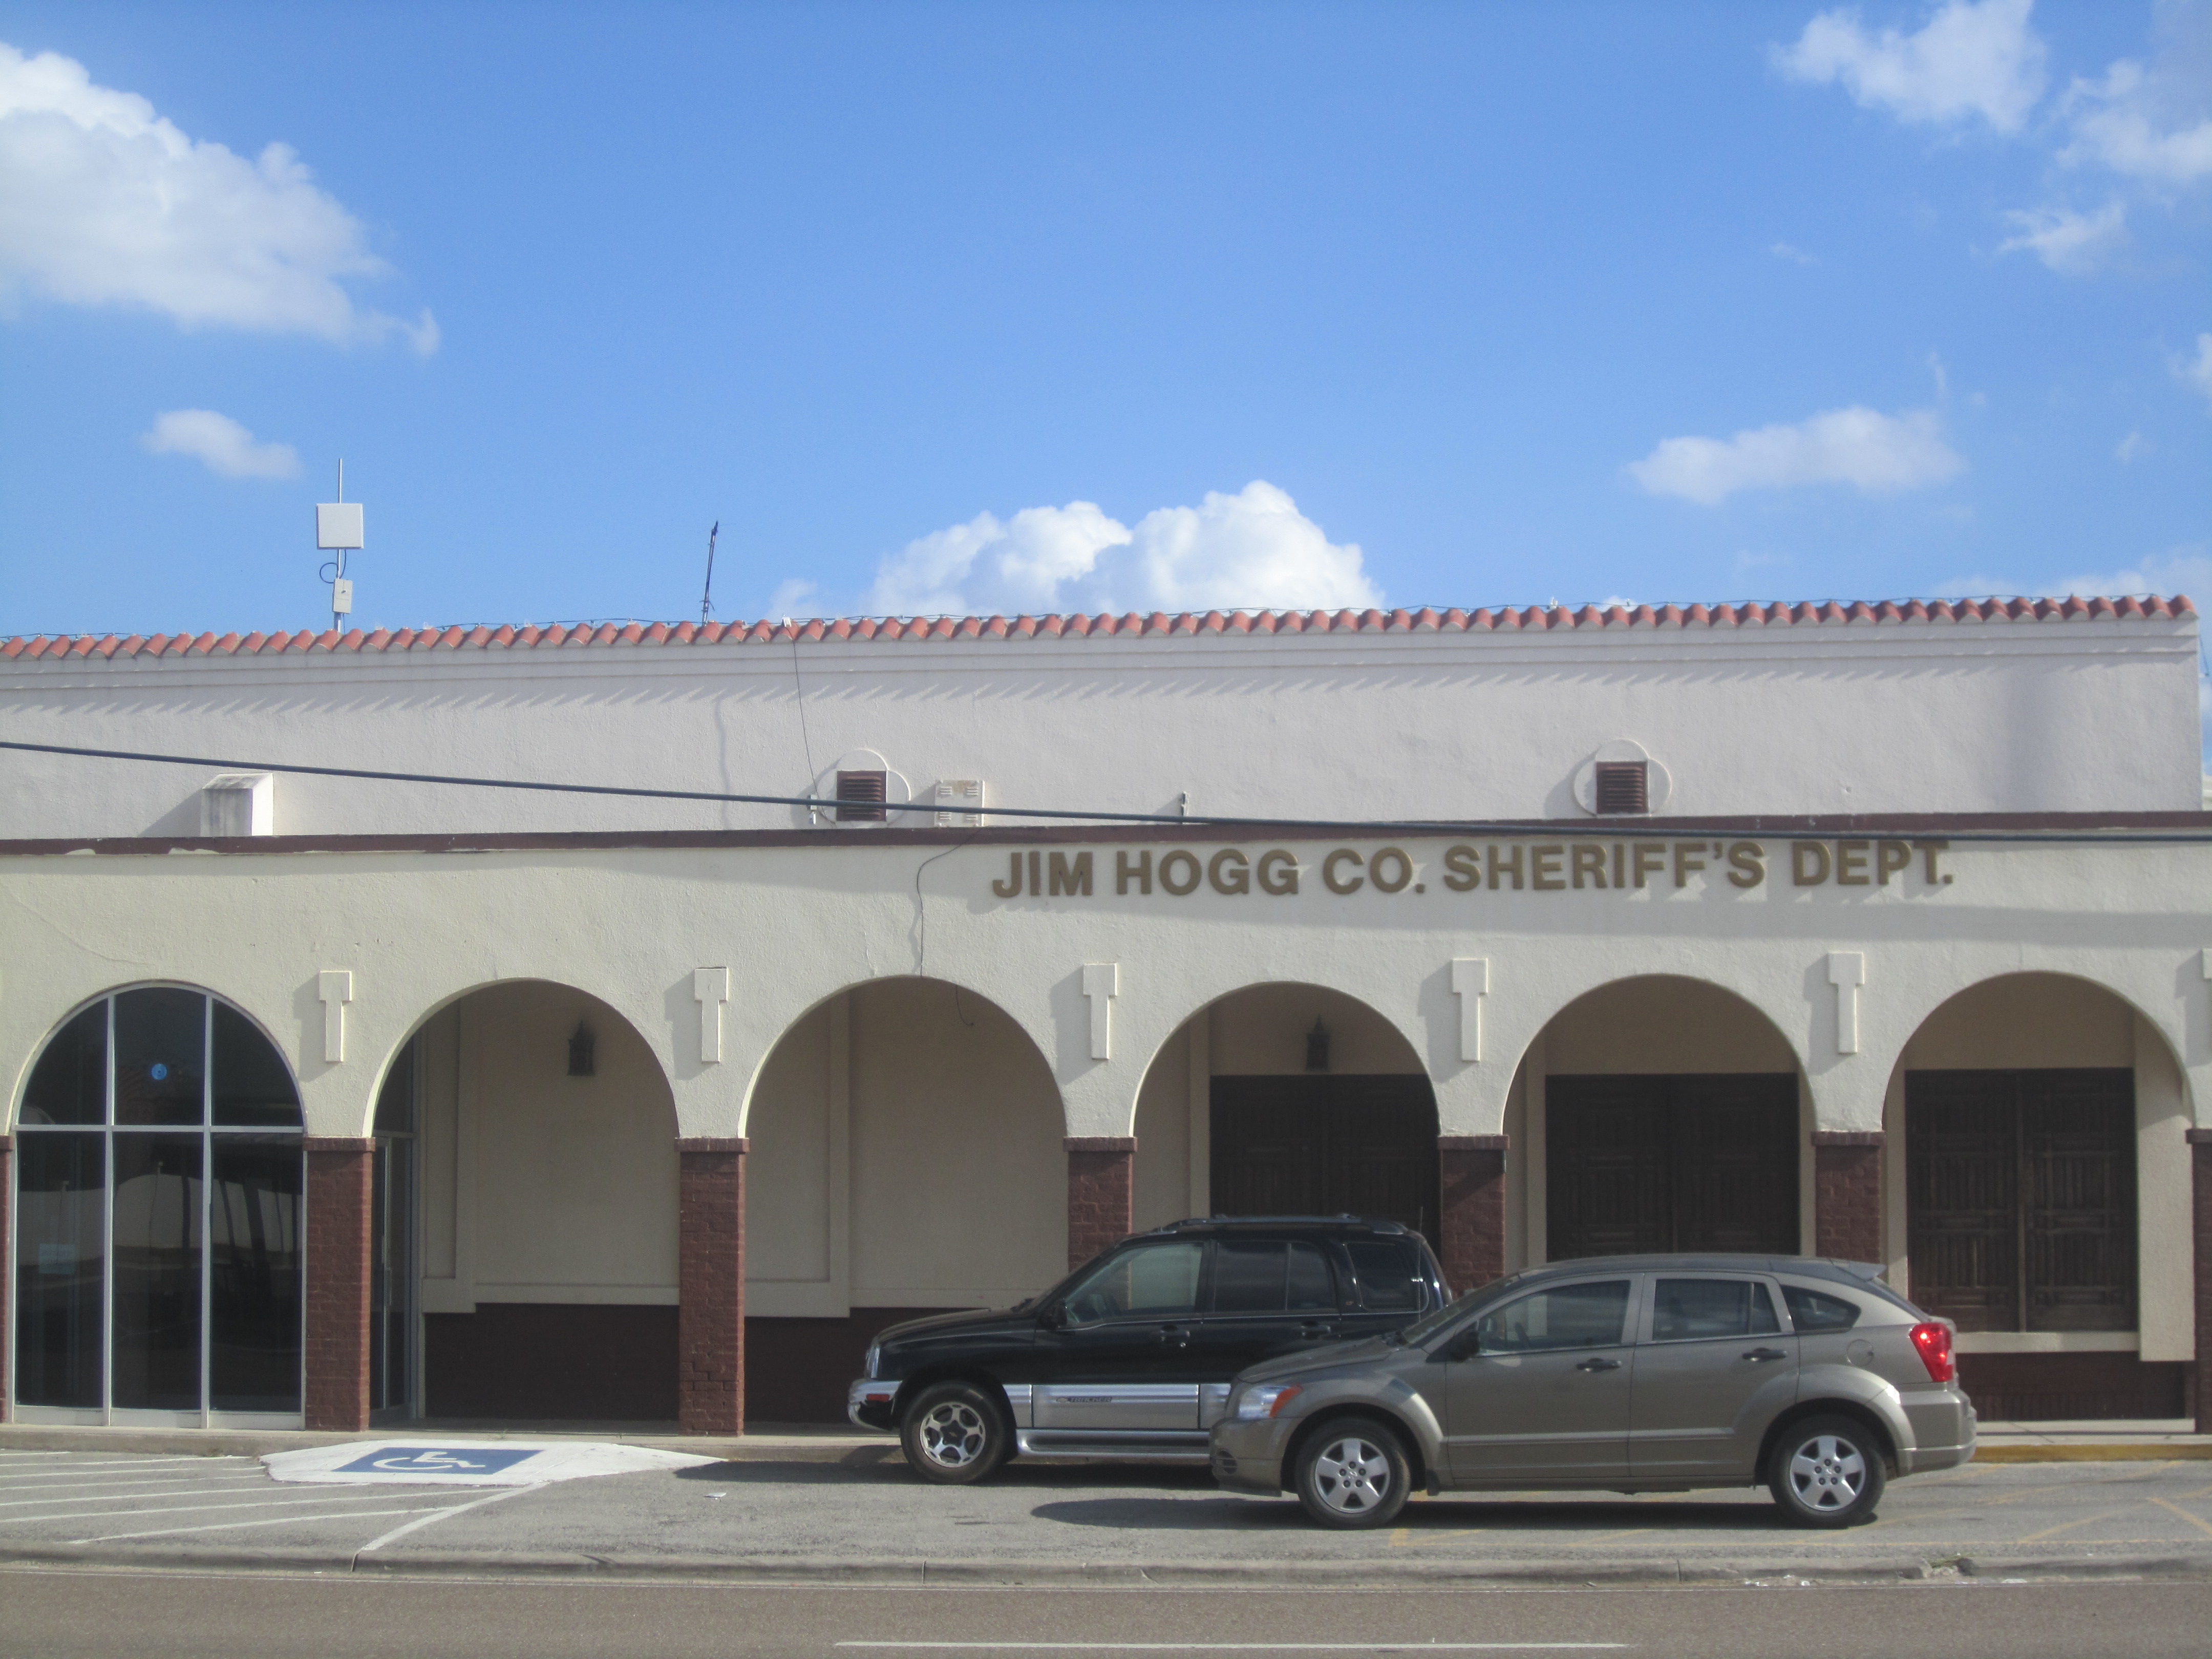

Sheriff's Office Hebbronville


South Texas Workforce Solutions office in Hebbronville
All of the county is served by the Jim Hogg County Independent School District.
The district has three schools: Hebbronville Elementary School, Hebbronville Junior High School, and Hebbronville High School. All of the schools are considered to be in the Hebbronville community.
Communities[]
Census-designated places[]
- Guerra
- Hebbronville (county seat)
- Las Lomitas
- South Fork Estates
- Thompsonville
Other unincorporated communities[]
- Agua Nueva
- Randado
There are no incorporated areas in Jim Hogg County.
References[]
- ^ a b "State & County QuickFacts". United States Census Bureau. http://quickfacts.census.gov/qfd/states/48/48247.html. Retrieved December 18, 2013.
- ^ "Find a County". National Association of Counties. Archived from the original on 2011-05-31. https://web.archive.org/web/20110531210815/http://www.naco.org/Counties/Pages/FindACounty.aspx. Retrieved 2011-06-07.
- ^ "2010 Census Gazetteer Files". United States Census Bureau. August 22, 2012. http://www2.census.gov/geo/docs/maps-data/data/gazetteer/counties_list_48.txt. Retrieved May 2, 2015.
- ^ "Population and Housing Unit Estimates". https://www.census.gov/programs-surveys/popest/data/tables.2016.html. Retrieved June 9, 2017.
- ^ "U.S. Decennial Census". United States Census Bureau. Archived from the original on May 12, 2015. http://www.webcitation.org/6YSasqtfX?url=http://www.census.gov/prod/www/decennial.html. Retrieved May 2, 2015.
- ^ "Texas Almanac: Population History of Counties from 1850–2010". Texas Almanac. http://texasalmanac.com/sites/default/files/images/topics/ctypophistweb2010.pdf. Retrieved May 2, 2015.
- ^ "American FactFinder". United States Census Bureau. http://factfinder2.census.gov. Retrieved 2011-05-14.
- ^ http://uselectionatlas.org/RESULTS
- ^ Sullivan, Robert David; ‘How the Red and Blue Map Evolved Over the Past Century’; America Magazine, June 29, 2016
- ^ The New York Times Electoral Map (Zoom in on Texas)
External links[]
- Jim Hogg County from the Handbook of Texas Online
- Jim Hogg County Profile from the Texas Association of Counties

|
Webb County | Duval County |
| |
| Zapata County | Brooks County | |||
 Jim Hogg County, Texas | ||||
| Starr County |
| ||||||||||||||

| |||||||||||||||||||||||

| This page uses content from the English language Wikipedia. The original content was at Jim Hogg County, Texas. The list of authors can be seen in the page history. As with this Familypedia wiki, the content of Wikipedia is available under the Creative Commons License. |